Secondary clarifier state point and RAS
Will the clarifiers hold at this flow, MLSS and SVI, and what is the least RAS flow that keeps the blanket from climbing? This tool runs the two state point checks: clarification (is the state point under the settling curve?) and thickening (does the RAS underflow line stay under the curve?).
Settling flux chart
Dark curve: gravity settling flux for this SVI. Dots: the state point for each group (red when it is above the curve). Solid lines: underflow lines at the trial RAS. Dashed lines: the current RAS. A clarifier holds when the state point is under the curve and the underflow line does not cross it.
By group
| Group | Area (sq ft) | Flow (MGD) | Trial RAS (MGD) | SOR (gpd/sq ft) | State point (% of curve) | Minimum RAS (MGD) | Result |
|---|
What if SVI or MLSS changes?
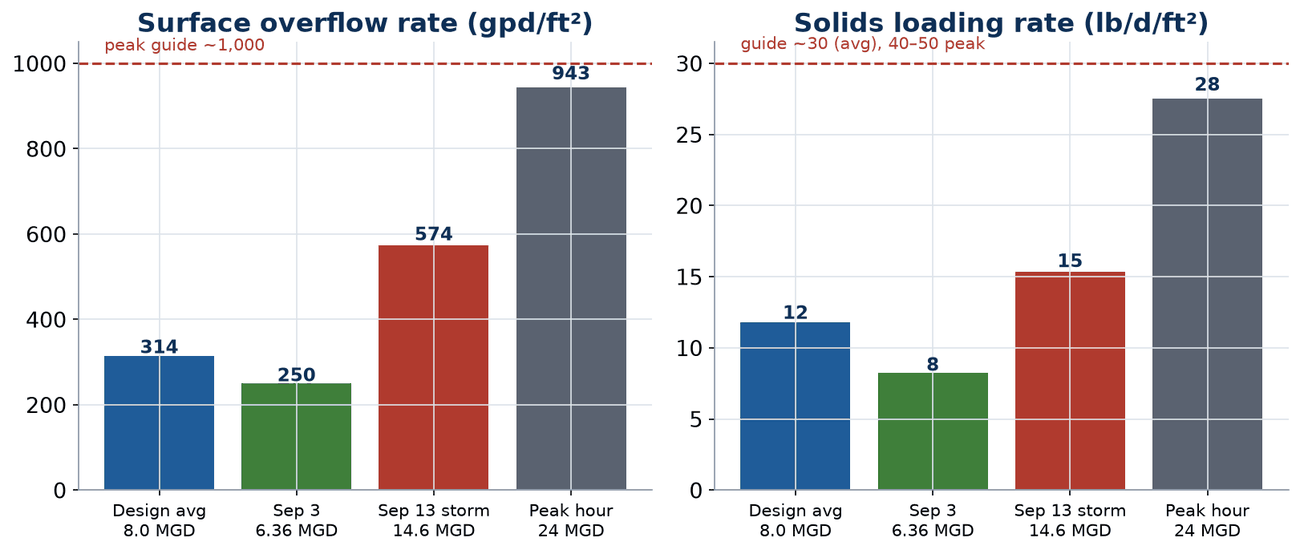
State point as a percent of the settling curve at this plant flow and clarifier area (clarification check only). Over 100% (red) means clarification failure. The 80% line between green and amber is a teaching rule of thumb, not a design standard.
Summary
How it works and where the numbers come from
Settling flux at a solids concentration X (g/L): G = X × γ × e−δ·SVI × e−(α + β·SVI)·X, with α = 0.261 L/g, β = 0.00166, δ = 0.0037 and γ = 14.9 m/h, converted to the units you pick.
State point flux = 8.34 × 1,000 × Q × X / A (lb/ft²/d with Q in MGD, X in g/L, A in sq ft). Applied solids load = 8.34 × 1,000 × (Q + R) × X / A. Underflow concentration XR = X (Q + R) / R.
Minimum RAS: the smallest R that keeps the underflow line 8,340 [(Q + R) X − R x] / A at or under the settling curve G(x) for every concentration x above X. If the state point is already above the curve, no RAS rate can fix it, and the tool says so.
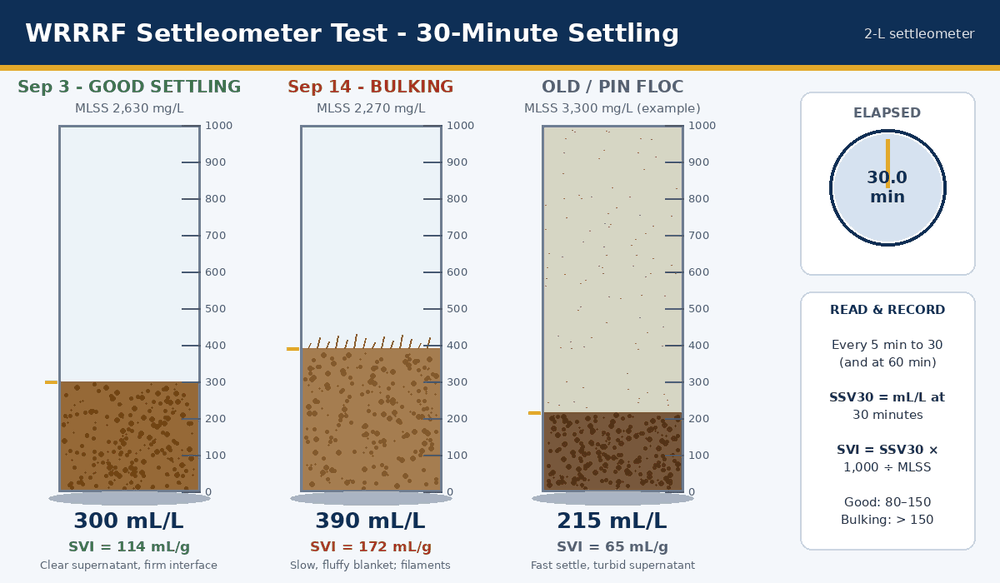
SVI: use the settling test your plant runs every day. Stirred and unstirred tests give different numbers, so keep to one method and watch the trend. The White River examples use the standard unstirred 30-minute test in a 2 L settleometer.
Sources. Settling coefficients: E.J. Wahlberg, Brown and Caldwell settling flux spreadsheet (1996), built on Wahlberg, E.J. and Keinath, T.M. (1988), “Development of settling flux curves using SVI,” Journal WPCF 60(12), 2095, and their 1995 addendum in Water Environment Research 67(5), 872. State point analysis: Keinath, T.M. (1985), “Operational dynamics and control of secondary clarifiers,” Journal WPCF 57(7), 770.